First edition, 2026Free to read before launch
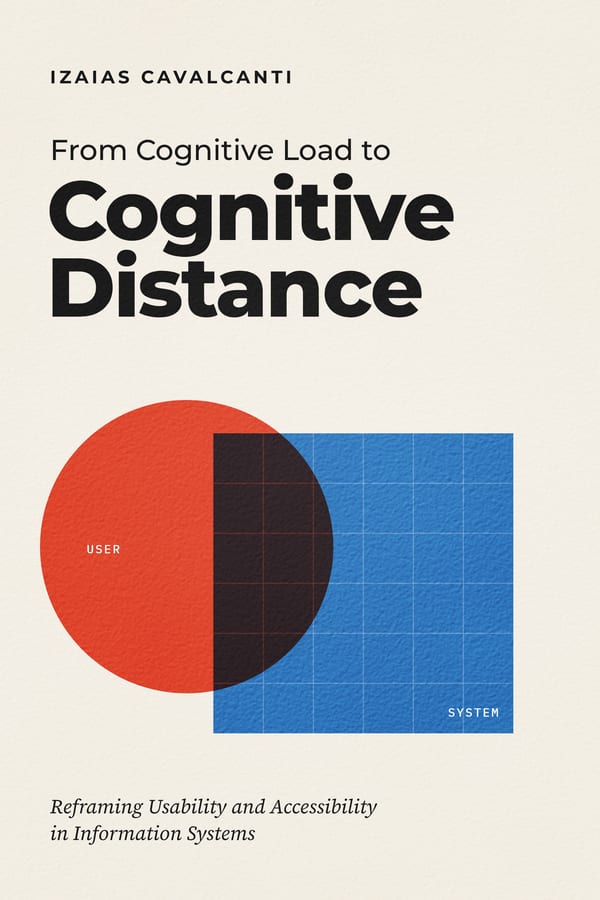
From Cognitive Load toCognitive Distance
Reframing Usability and Accessibility in Information Systems
People finish the task. They still can’t say what just happened. That gap has a name. This book defines it, shows how to measure it, and explains how to design it away.
- Pages
- 118
- Chapters
- 13
- Works cited
- 66
- Paperback and Kindle
- Soon
Two screens. Same transfer. Only one tells you what happened.
Both are short, error-free and fast. Both pass a usability test. The difference between them is not effort. It is distance.
Operation processed successfully. Authentication: 8F2-9921-B. Ref: TX-29381.
Done. Mary receives $200.00 today by 18:00. The money has left your account. You do not need to do anything else.
Both screens come from the Everyday Services Study, described in Chapter 6, which tests banking, medical appointment and licence renewal screens in English, Spanish and Portuguese.
The idea
Cognitive distance is the degree of mismatch between the conceptual structure that a system requires for correct interpretation and the mental model that a user actually constructs during interaction.
Until now
Load
How hard a system makes you think.
For decades, design has treated confusion as a problem of effort: fewer steps, cleaner screens, less to remember. Those changes help.
This book
Distance
How far its logic is from yours.
Effort does not explain why people who complete every task still feel one mistake away from breaking something. Distance does.
Easy is not the same as understood.
Effort and alignment vary independently. The condition that matters most looks like success on every dashboard: the interaction is effortless, the task is complete, and the person has no idea what the system did.
Booking travel takes many steps, yet most people understand it because it follows everyday planning logic. A three-field form can defeat them when its order and language mirror a database instead of a goal.
| Low load | High load | |
|---|---|---|
| High distance | Easy but opaqueInteraction looks easy, but understanding is fragile. People finish without confidence. This is the failure effort-based evaluation misses. | Demanding and opaqueThe most fragile condition. Tasks feel difficult and the system’s logic feels alien. |
| Low distance | Effortless and clearFast, clear interactions. People understand what to do and why it works. | Demanding but transparentEffort is high, but people build stable understanding because the structure is coherent. |
Three properties change how systems should be designed and judged.
- Relational
It belongs to the fit, not the screen
The same result screen sits close to a bank clerk who knows settlement terms and far from a first-time customer who does not. Every measurement has to say whose distance it measures.
- Cumulative
It builds up like debt
Effort rises and falls within a task. Distance accumulates across interactions and design decisions, so a single test can miss the long-term cost of an opaque system.
- Independent of effort
It can peak when effort is lowest
A user presses Confirm, sees a short result in under five seconds, makes no errors, and every metric reports success. Cognitive distance is at its maximum.
What gets measured gets designed.
Completion rates tell you a task was done. The Cognitive Distance Index tells you whether it was understood: four questions, one score from 0 to 100, where 0 is complete alignment.
- Perceived understandingCan the person explain, in plain words, what the system just did?
- Predictive accuracyCan they anticipate the outcome before it is shown?
- Interaction confidenceDo they feel certain about what happened and what to do next?
- Conceptual transparencyCan they identify why the outcome occurred, not only what it was?
How to read a CDI score
- 0–25
- Strong alignmentPeople explain outcomes correctly and predict what comes next.
- 26–45
- Early warningScattered confusion. Review wording and feedback.
- 46–65
- Needs attentionMisunderstanding recurs. Redesign results and labels.
- 66–100
- Serious misalignmentPeople succeed operationally and fail interpretively.
Thirteen chapters, from the problem to the practice.
Chapter by chapter, the person’s model moves into the system’s grid, the way the book moves from diagnosis to design. Every chapter is free to read online.
- 01The Distance Problem
- 02How Systems Drift Away From Human Thinking
- 03Mental Models and the Architecture of Understanding
- 04Usability Revisited: When Easy Does Not Mean Understandable
- 05Accessibility and the Hidden Dimension of Cognitive Barriers
- 06Measuring the Invisible: Detecting Cognitive Distance in Real Systems
- 07Design Assumptions and the Architecture of Misunderstanding
- 08Designing for Alignment: Reducing Cognitive Distance
- 09Artificial Intelligence and the Expanding Distance
- 10Systems, Institutions, and the Distance Between People and Digital Power
- 11A Practical Framework for Evaluating Cognitive Distance
- 12Toward a New Paradigm in Human-Computer Interaction
- 13Closing the Distance
118 pages · about 21 thousand words · 66 works citedStart reading →
The distance is real, and it can be designed.
For anyone who suspects “usable” is not the whole story.
- 01
Designers
A vocabulary and a set of methods for the problems that simplification alone cannot fix.
- 02
Researchers
A construct with a formal definition, clear boundaries and an instrument ready for testing.
- 03
Product leaders
A way to see the support costs, retraining cycles and lost trust that completion rates hide.
- 04
Policymakers and public servants
A lens on why compliant digital services still leave citizens confused, dependent or excluded.
Izaias Cavalcanti
Izaias Cavalcanti researches cognitive distance in information systems, drawing on a background in UX and product design. The work asks why people complete digital tasks without understanding what the system did, and how that gap can be measured and designed away.
- ConstructCognitive distance, defined and separated from cognitive load
- InstrumentThe Cognitive Distance Index
- ExperimentThe Everyday Services Study
- FocusPublic services, banking and healthcare
Questions, answered.
The short version of what the book argues. For the long version, read the explainer.
What is cognitive distance?
Cognitive distance is the degree of mismatch between the conceptual structure that a system requires for correct interpretation and the mental model that a user actually constructs during interaction. In plain terms, it is the gap between how a system works and how the person using it thinks it works. When the distance is small, people can predict what will happen and explain what did. When it is large, they can still finish the task, but they cannot say what the system did or why.
How is cognitive distance different from cognitive load?
Cognitive load is how much mental effort a task demands right now. Cognitive distance is how far a system’s logic sits from the way its users frame the task. The two vary independently: a short, effortless flow can have high distance, and a long, demanding one can have low distance. Load asks how hard a system makes people think. Distance asks whether they end up understanding it.
Can a system be easy to use and still be hard to understand?
Yes. This is the condition the book calls easy but opaque: low effort, high distance. A person presses Confirm, sees a short result screen in seconds, makes no errors, and every usability metric reports success, yet they cannot explain what happened. It is the failure that effort-based evaluation misses, and it is common in banking, healthcare, public services and AI products.
How do you measure cognitive distance?
The book introduces the Cognitive Distance Index (CDI). It scores four dimensions from 0 to 100: perceived understanding, predictive accuracy, interaction confidence and conceptual transparency. The CDI is the mean of the available dimension scores, reported on at least two. Scores of 0 to 25 indicate strong alignment, 26 to 45 an early warning, 46 to 65 a need for attention, and 66 to 100 serious misalignment.
What are the signs of high cognitive distance?
Common signs are hesitation before choosing an option, repeated backtracking to earlier screens, reliance on private notes or checklists for routine tasks, repeated actions to check that a task really completed, and support calls about systems that pass usability tests. The clearest sign is a person who completes a task and then says they are not sure what happened.
How do you reduce cognitive distance?
The book sets out four principles: design for mental model formation, internalize explanation, support learning over time, and validate understanding, not only performance. In practice that means organizing systems around people’s goals rather than internal structures, using their vocabulary, explaining outcomes instead of only confirming them, and testing whether people can predict and explain what the system does.
Why does cognitive distance matter for accessibility?
A service can meet technical accessibility standards and still exclude people who cannot interpret its logic. Cognitive distance names that conceptual barrier. Because it accumulates across screens and decisions, its cost behaves like debt, which the book calls accessibility debt. Systems also widen the distance through externalized processing: handing people work the system could do itself, such as converting or compressing a file before upload.
Why does artificial intelligence make cognitive distance more important?
Traditional software follows explicit rules that people can learn. AI systems are probabilistic and often present themselves through a single text box, so they look simple while their boundaries and reasoning stay hidden. People can feel they understand a conversational system long before they grasp how it produces its answers. That gap is cognitive distance, and the book shows how explanation design can narrow it.
Who wrote From Cognitive Load to Cognitive Distance?
Izaias Cavalcanti, a researcher of cognitive distance in information systems with a background in UX and product design. The book draws on the author’s research program on cognitive distance, including the Cognitive Distance Index and the Everyday Services Study.
Is the book free?
Yes. Before launch, the complete book is free to read online and to download as a PDF (118 pages). You are welcome to share the link.
When will the book be published?
Soon. The paperback and Kindle editions are being prepared. Until then, the full text is available here at no cost.
Read the whole book now. Pass it on.
The complete text is free online and as a PDF until the paperback and Kindle editions arrive.